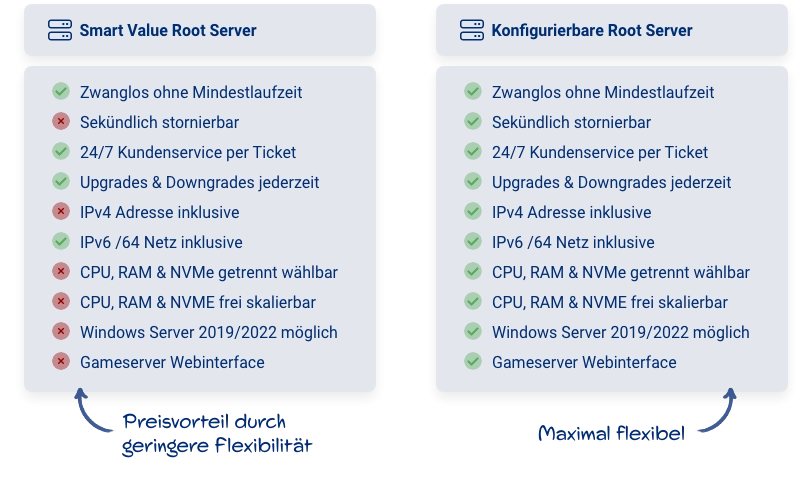
If you have to choose between a configurable server and a package server, there are a few differences you should consider. Package servers, often referred to as “Smart Value Root Servers”, offer solid performance and excellent value for money. They are a smart choice if you value a cost-effective solution with reliable basic features and want to keep an eye on your budget. These servers are particularly suitable if you do not need extensive web interface functions and are looking for a reliable platform without long-term commitment.
On the other hand, configurable servers offer maximum flexibility and are ideal for projects that evolve and grow. They allow you to customize and even expand server resources such as CPU, RAM, and storage space. These servers seamlessly adapt to the requirements of your project, whether you prefer Linux or Windows.

Here is a list of points that differ between the two types of servers:
- Price advantage: Smart Value Root Servers offer a price advantage due to less flexibility.
- Flexibility: Configurable servers are maximally flexible in adjusting resources.
- Scalability: With configurable servers, you can scale CPU, RAM, and NVMe as needed.
- Customization of hardware: Hardware components can be freely chosen for configurable servers.
- Operating system: While configurable servers support various operating systems such as Windows Server 2019/2022, package servers only offer Linux systems and an ISO install system.
- Web interface functions: If you don’t place much value on extensive web interface functions, package servers can be a good choice.
- Immediate termination: You can return configurable servers at any time and receive the remaining term as credit. This is not possible with package servers.
- Customer service: Both server variants offer the same 24/7 customer service via ticket.
Ultimately, it depends on what is most important for your project: cost optimization or the ability to tailor your server exactly to your needs.

